
NordicGrid
Website
Nordic power flows, production and electricity prices — live.
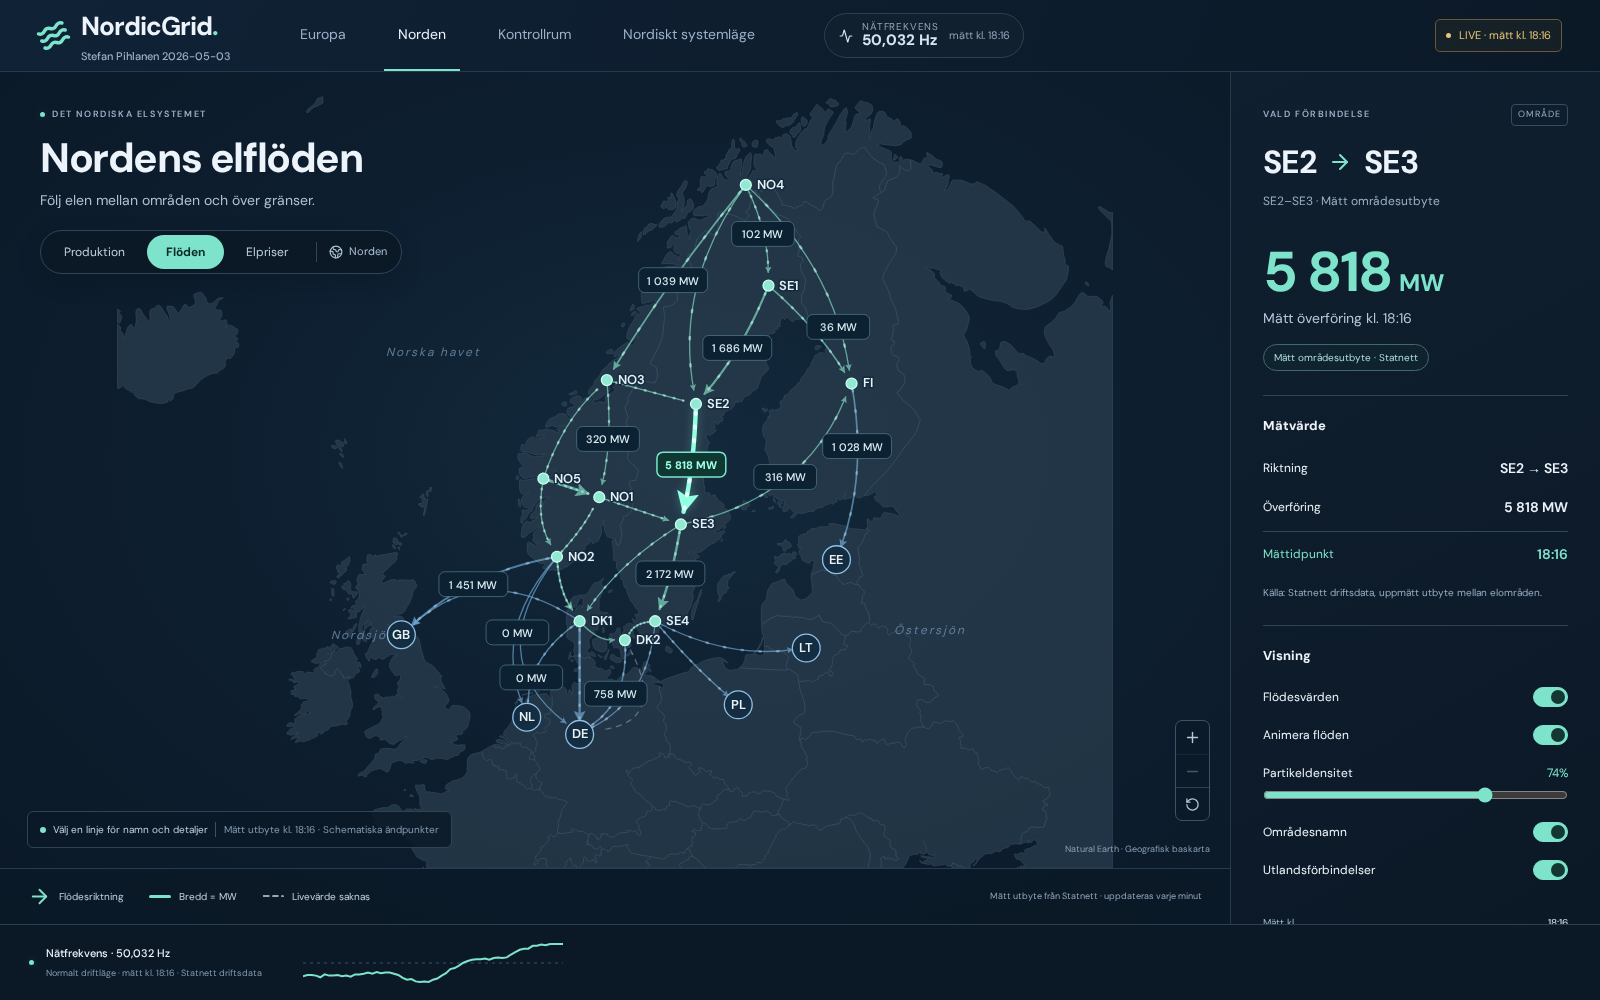
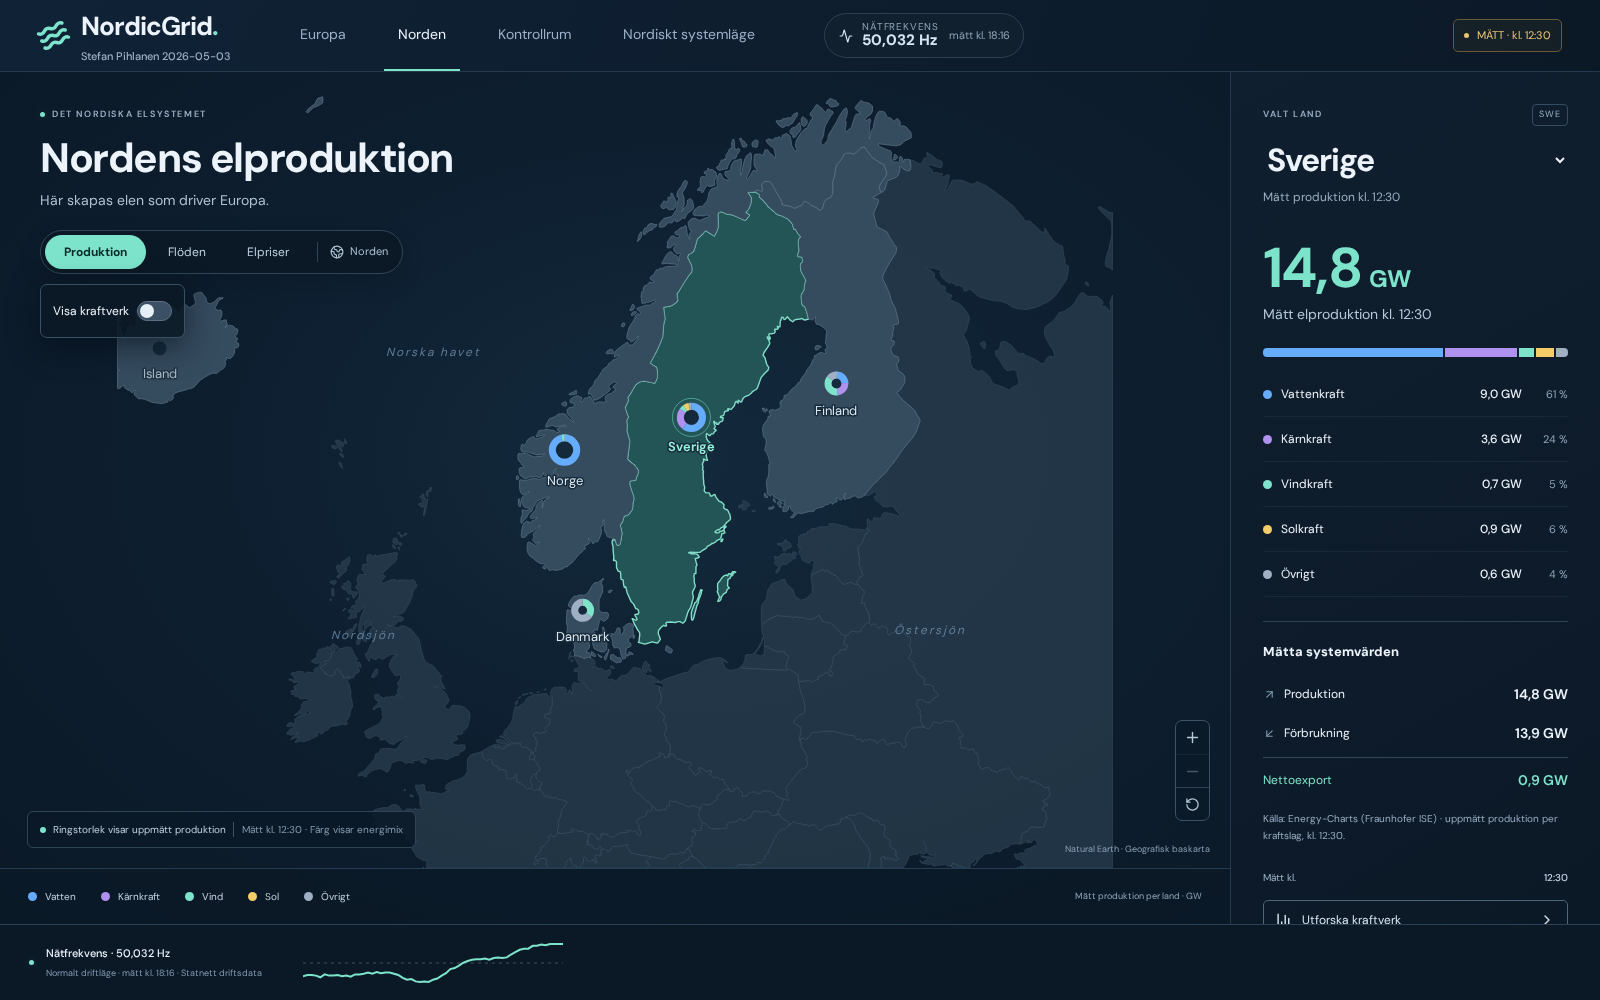
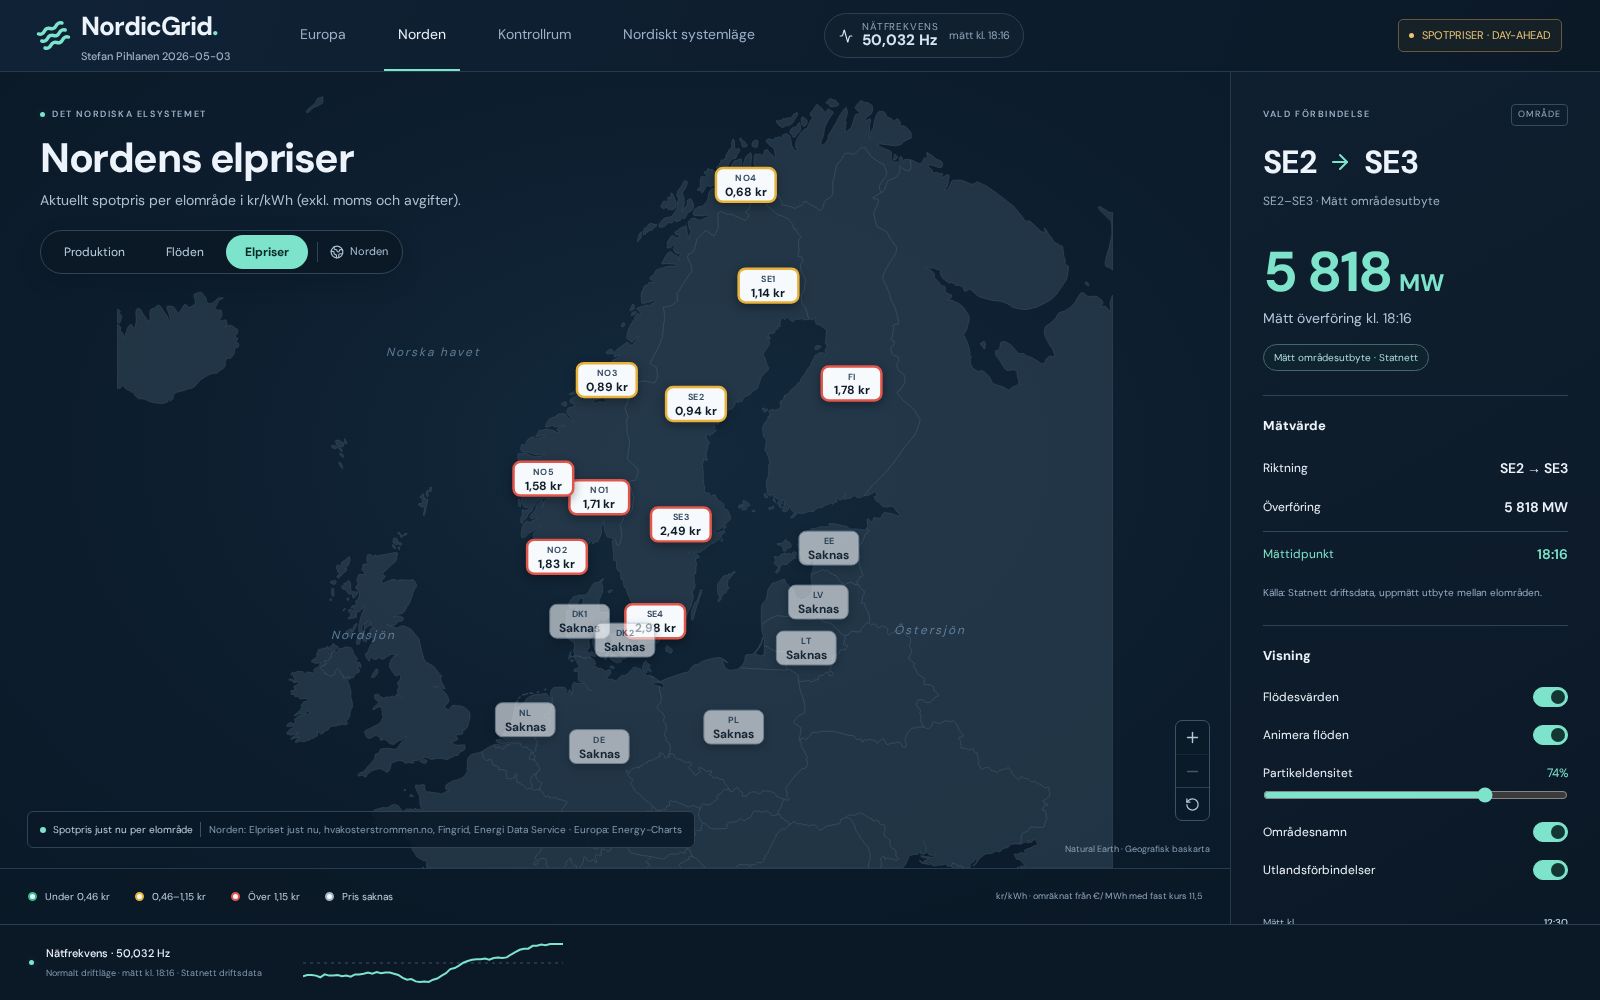
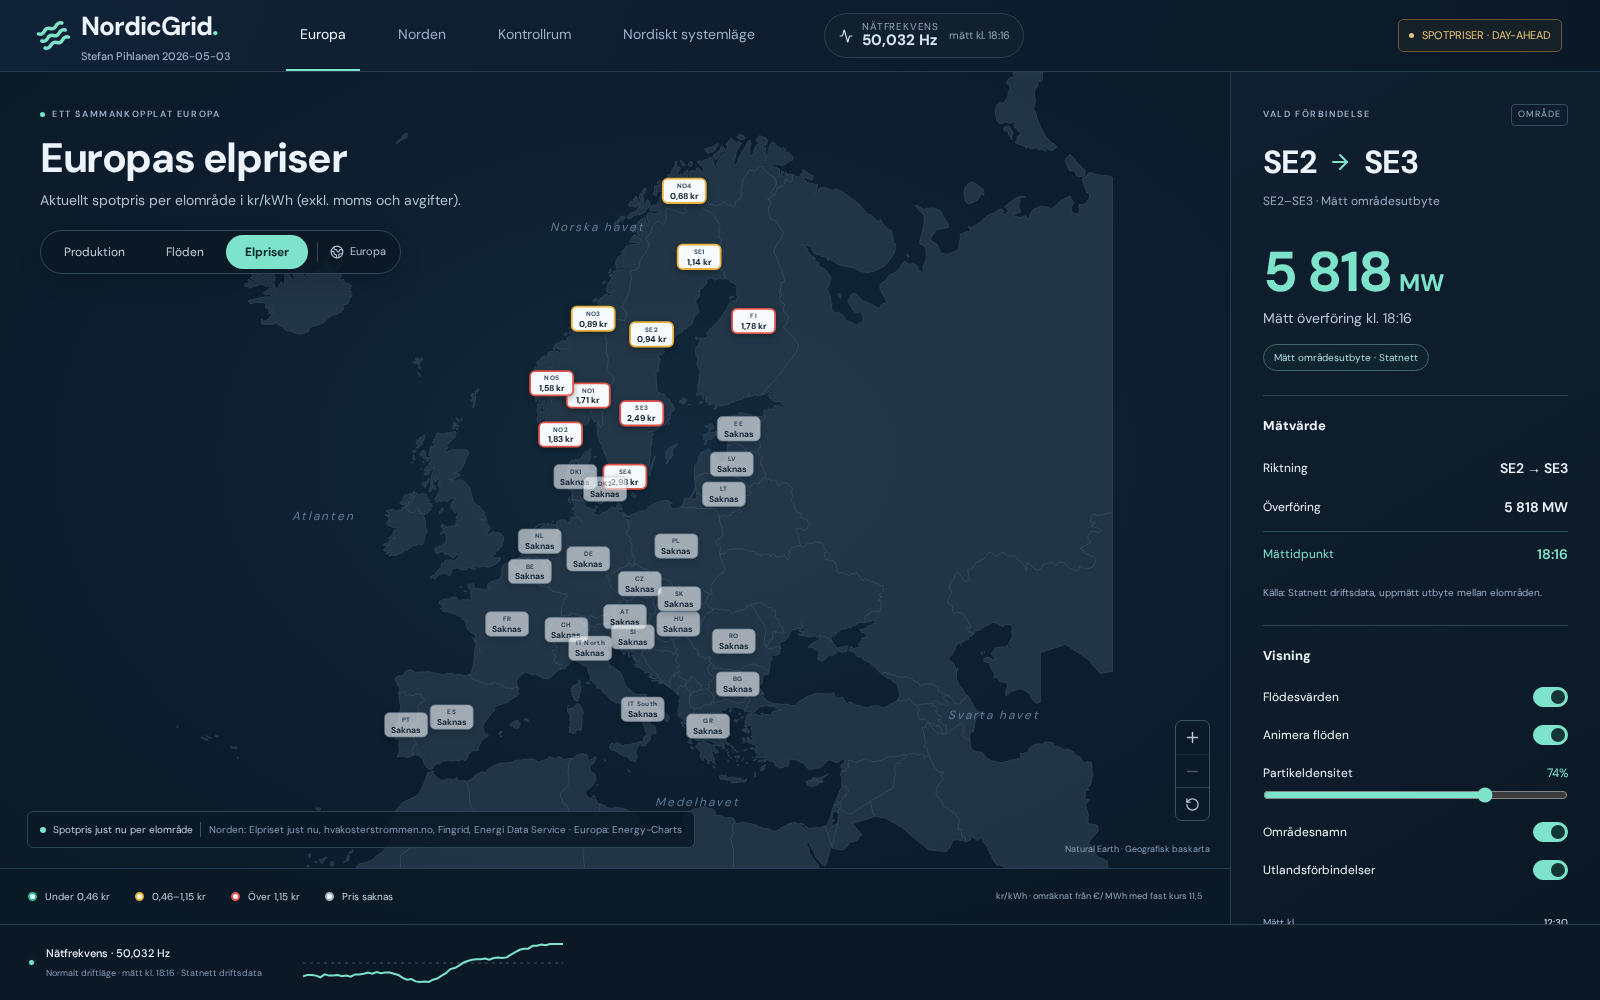
What it does.
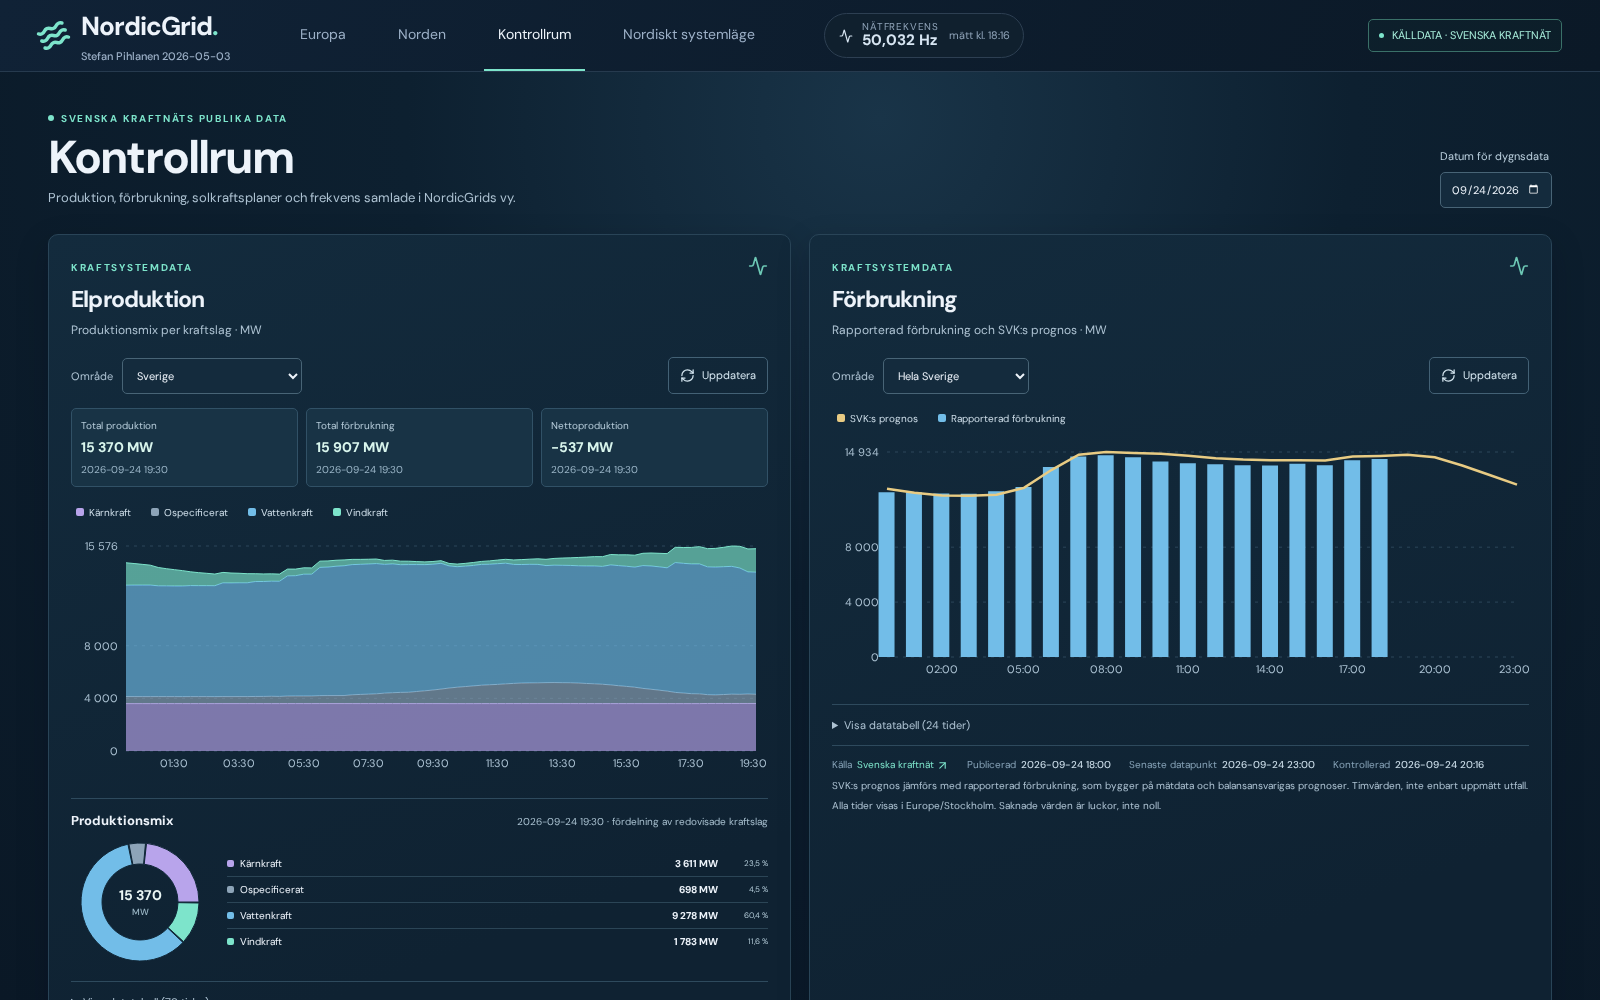
NordicGrid makes the Nordic power system easier to read. Move between Production, Flows and Electricity prices for the Nordic region, or expand the map to Europe. The flow view shows measured exchange between bidding zones such as SE1–SE4, NO1–NO5, Finland and Denmark, including direction, transfer in MW and measurement time. The production view shows measured output and energy mix by country. Electricity prices displays current day-ahead spot prices by bidding zone in kr/kWh, while the control room brings together production, consumption, solar plans and Nordic grid frequency. Sources and timestamps are shown beside the figures. Measured values, forecasts and market prices are identified separately, and missing data is shown as missing rather than zero.
Designed with intent.
- Production, Flows and Electricity prices as dedicated map modes
- Measured exchange, direction and MW transfer between Nordic bidding zones
- Measured production and energy mix by country across the Nordic region and Europe
- Day-ahead spot prices per bidding zone, displayed in kr/kWh
- Nordic grid frequency with measurement time and operating status
- Control room for production, consumption, solar plans and frequency
- Clear sources and timestamps — missing values remain missing, never zero-filled
- Runs in the browser — no installation required
Common questions.
Need help with NordicGrid?
Send us a message — we read and reply to every one.